
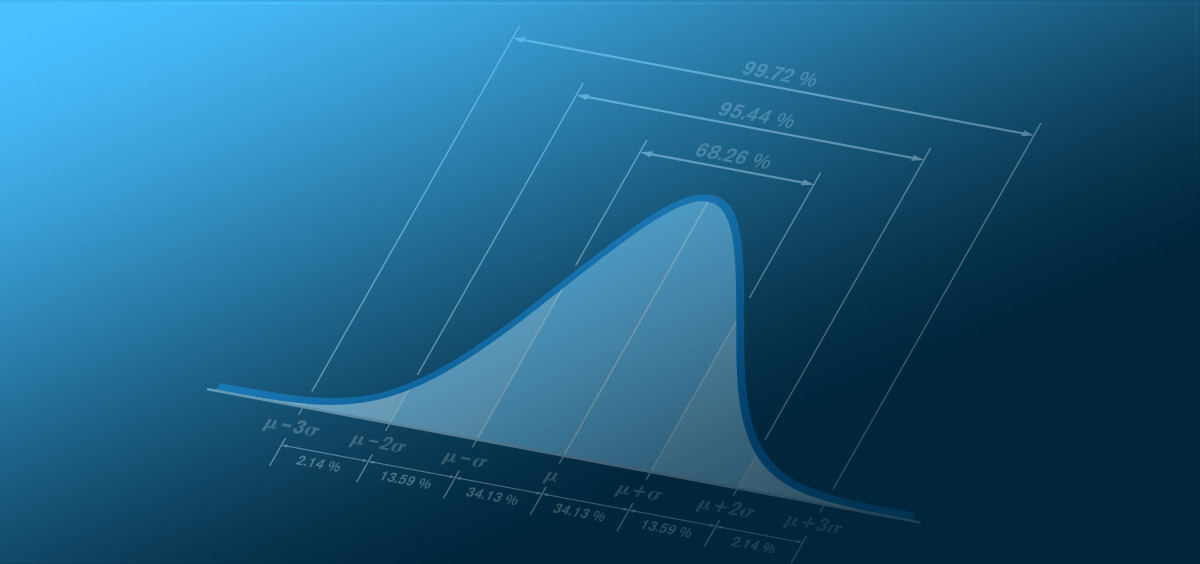
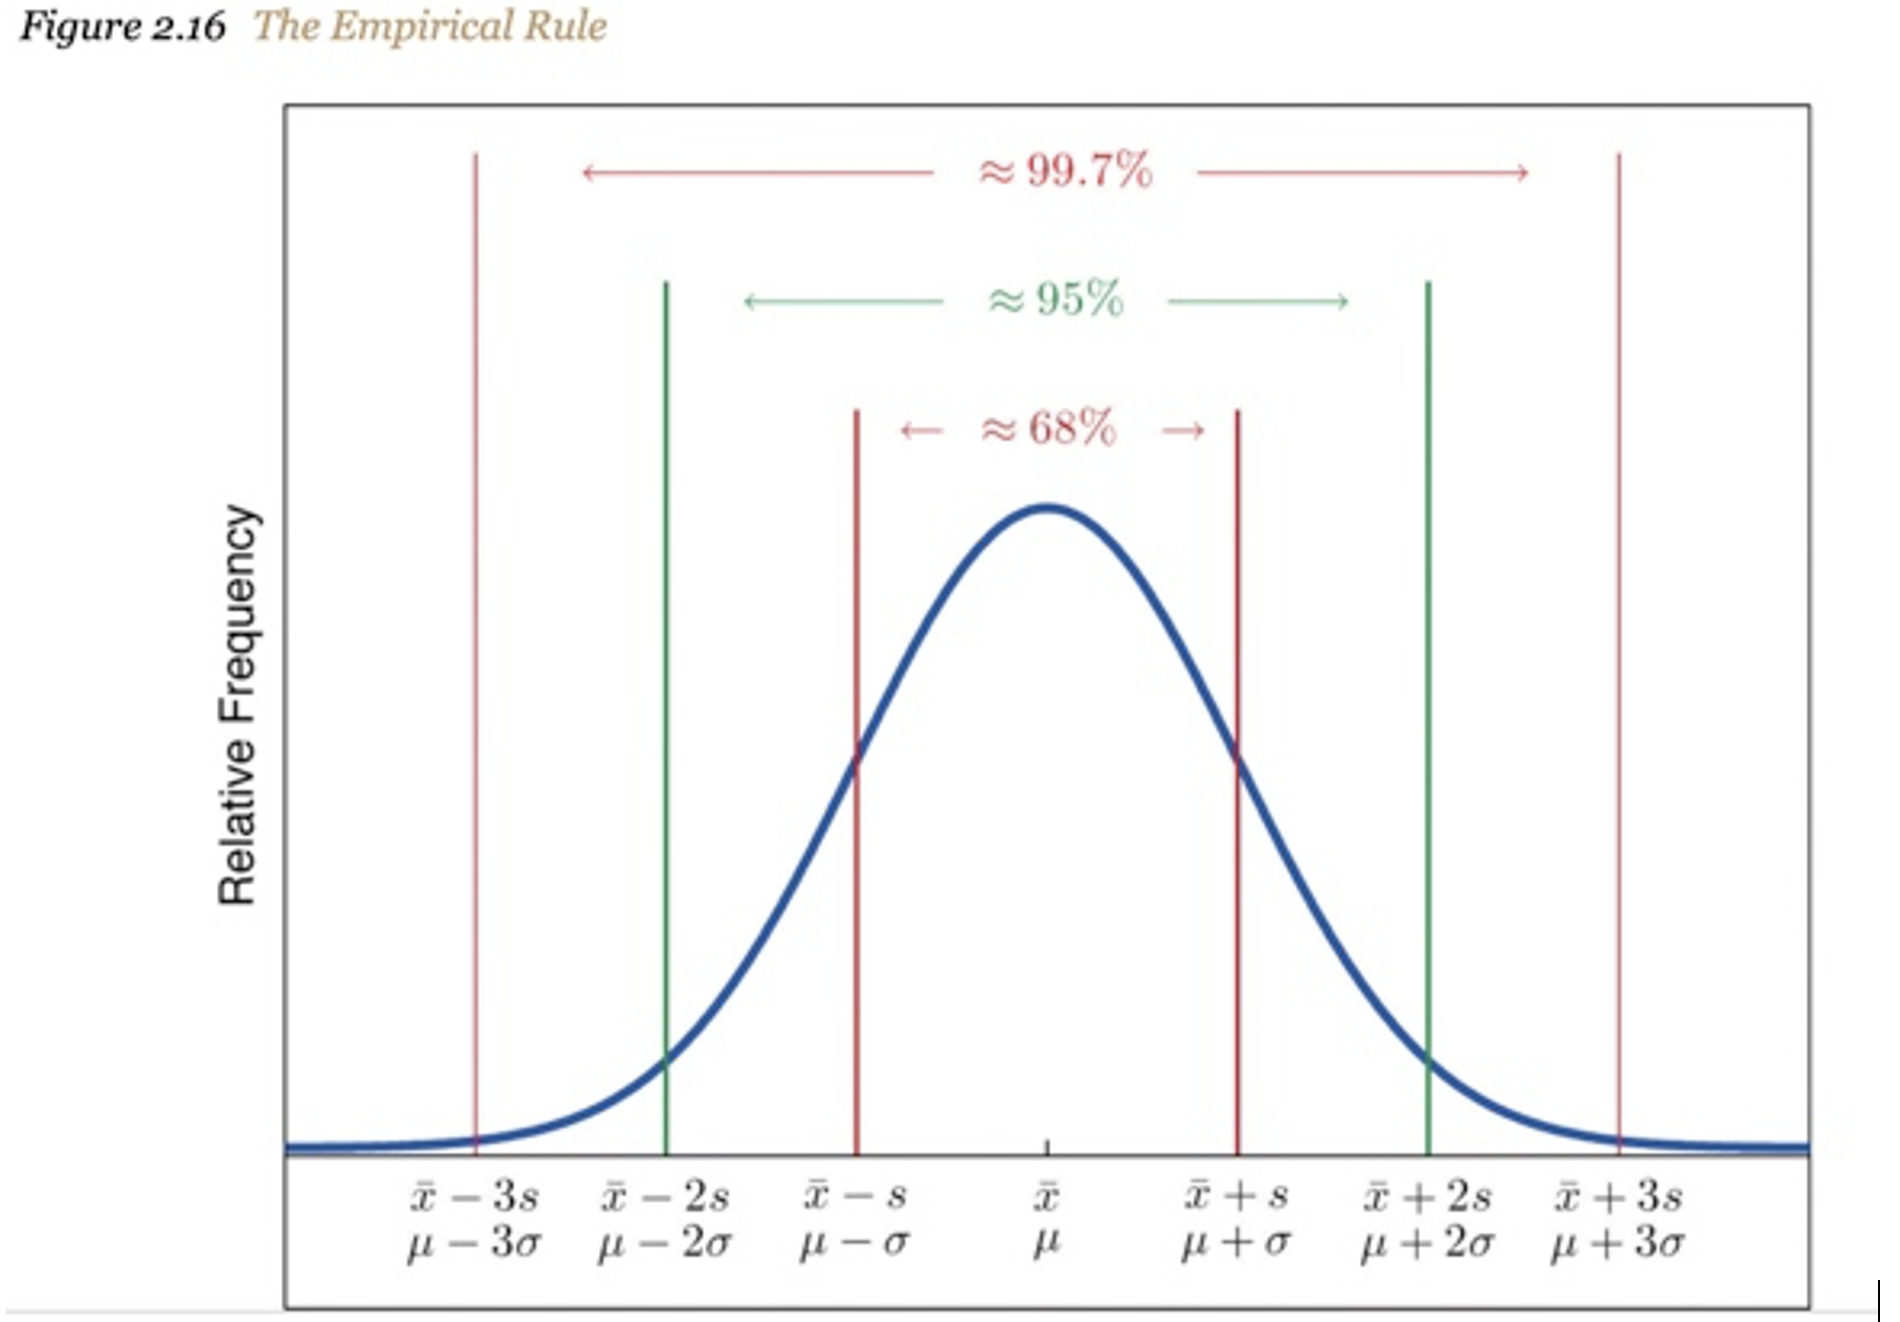
We are all aware of the “bell-shaped curve” and the distribution of data within the standard deviations.
*adopted from “Introductory Statistics” https://saylordotorg.github.io/text_introductory-statistics/s06-05-the-empirical-rule-and-chebysh.html
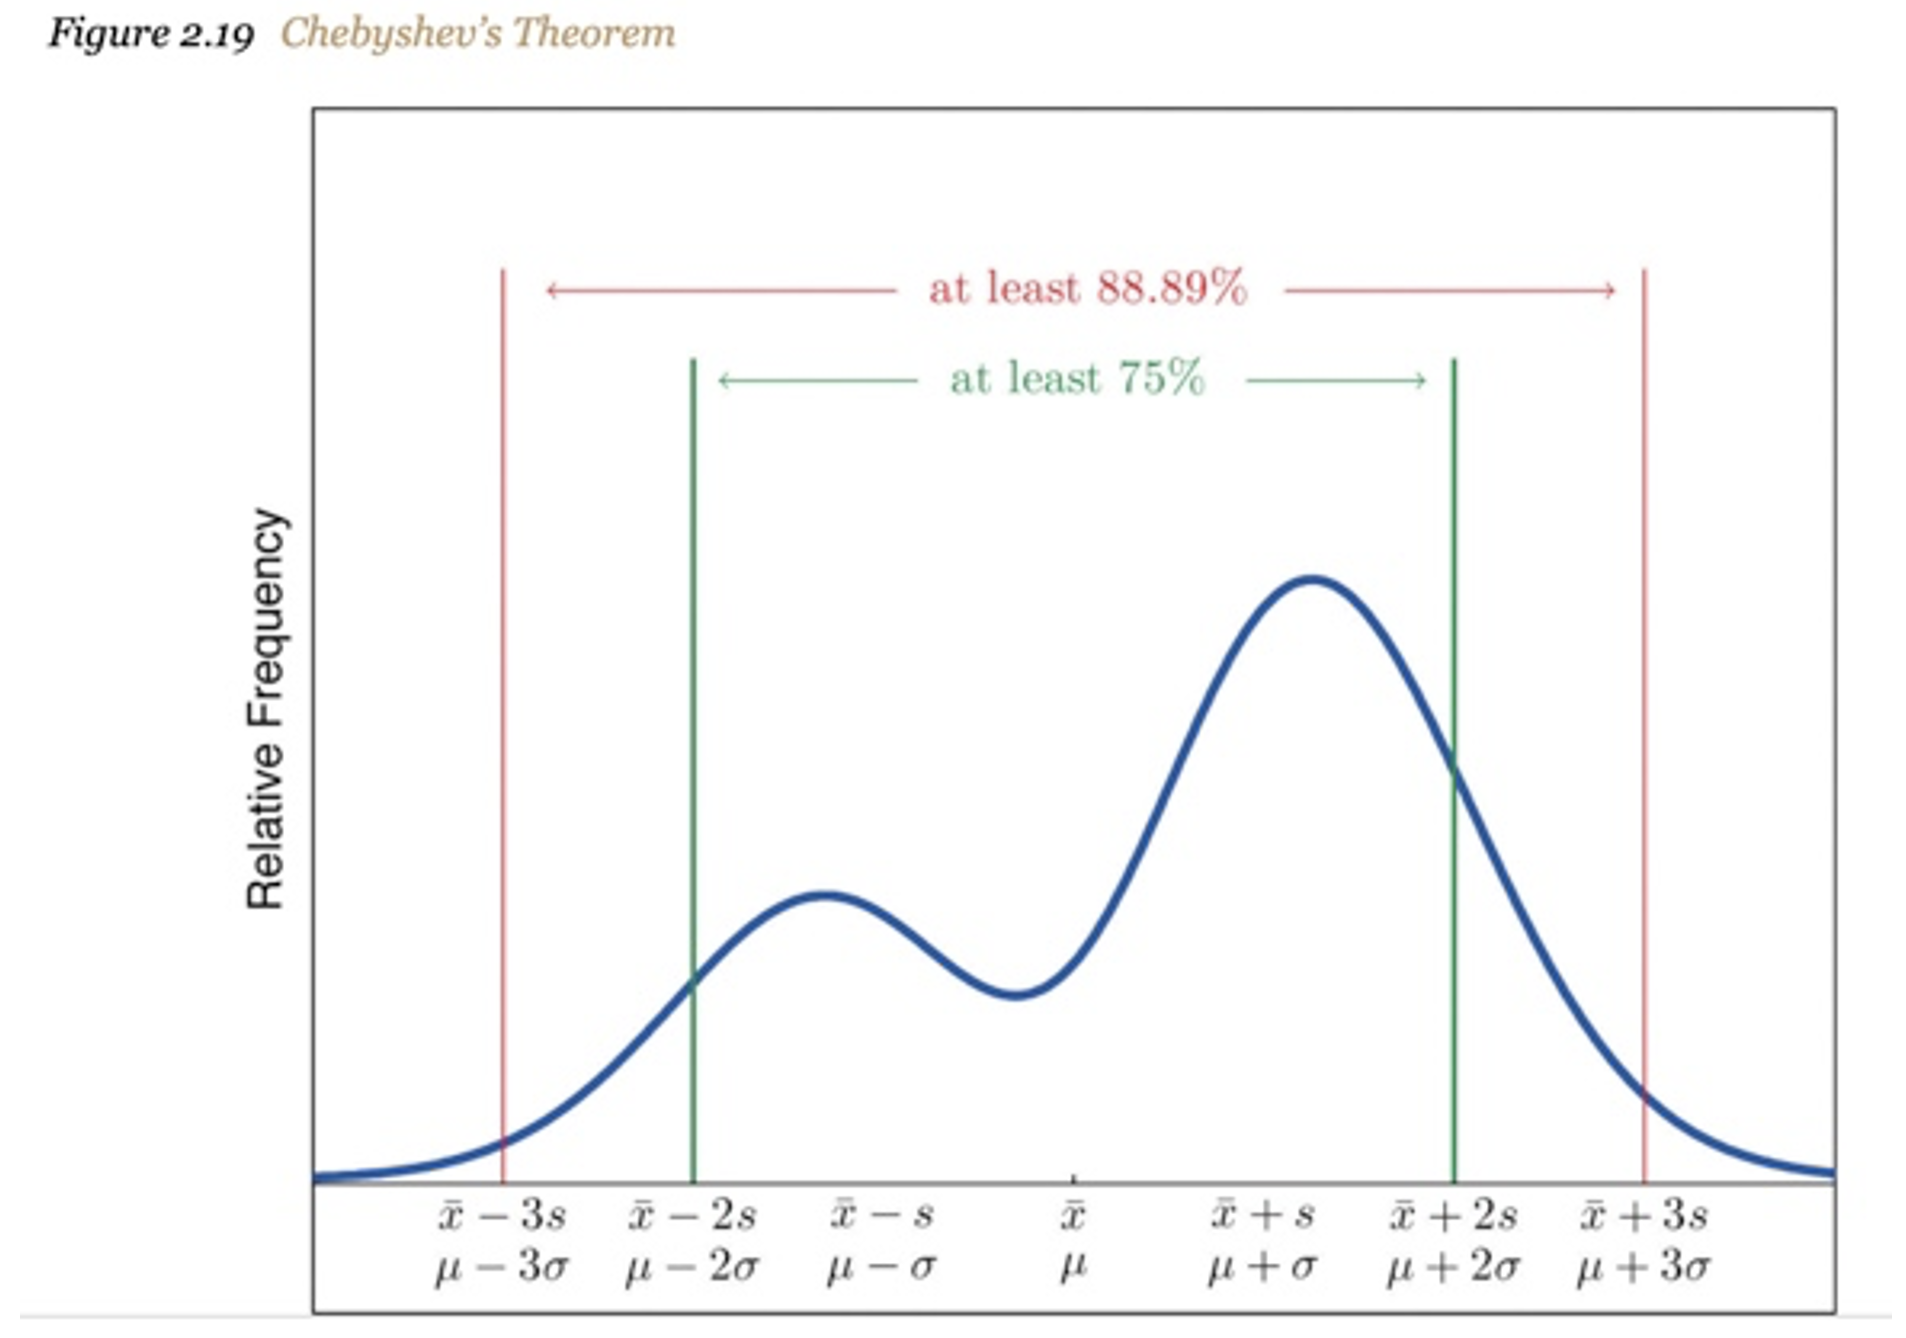
But there is one particularly applicable law for B2B market research, called Chebyshev's Theorem. Essentially, "it helps you determine where most of your data fall within a distribution of values. This theorem provides beneficial results when you have only the mean and standard deviation, and you do not need to know the distribution your data."
"Amazingly, even if it is inappropriate to use the mean and the standard deviation as the measures of center and spread, there is an algebraic relationship between them that can be exploited in any distribution."
In fact, for any numerical data set, at least 93.75% of the data lie within four standard deviations of the mean. Clear Seas uses this law to account for severe outliers in our data, even when we do not know our data's underlying center and spread for any given survey. Here, we're using Chebyshev's as an instance of "nonparametric" statistics because we do not need to specify the distribution.
Because nonparametric statistics is independent of the particular distribution, it is often more robust.
*adopted from “Introductory Statistics” https://saylordotorg.github.io/text_introductory-statistics/s06-05-the-empirical-rule-and-chebysh.html
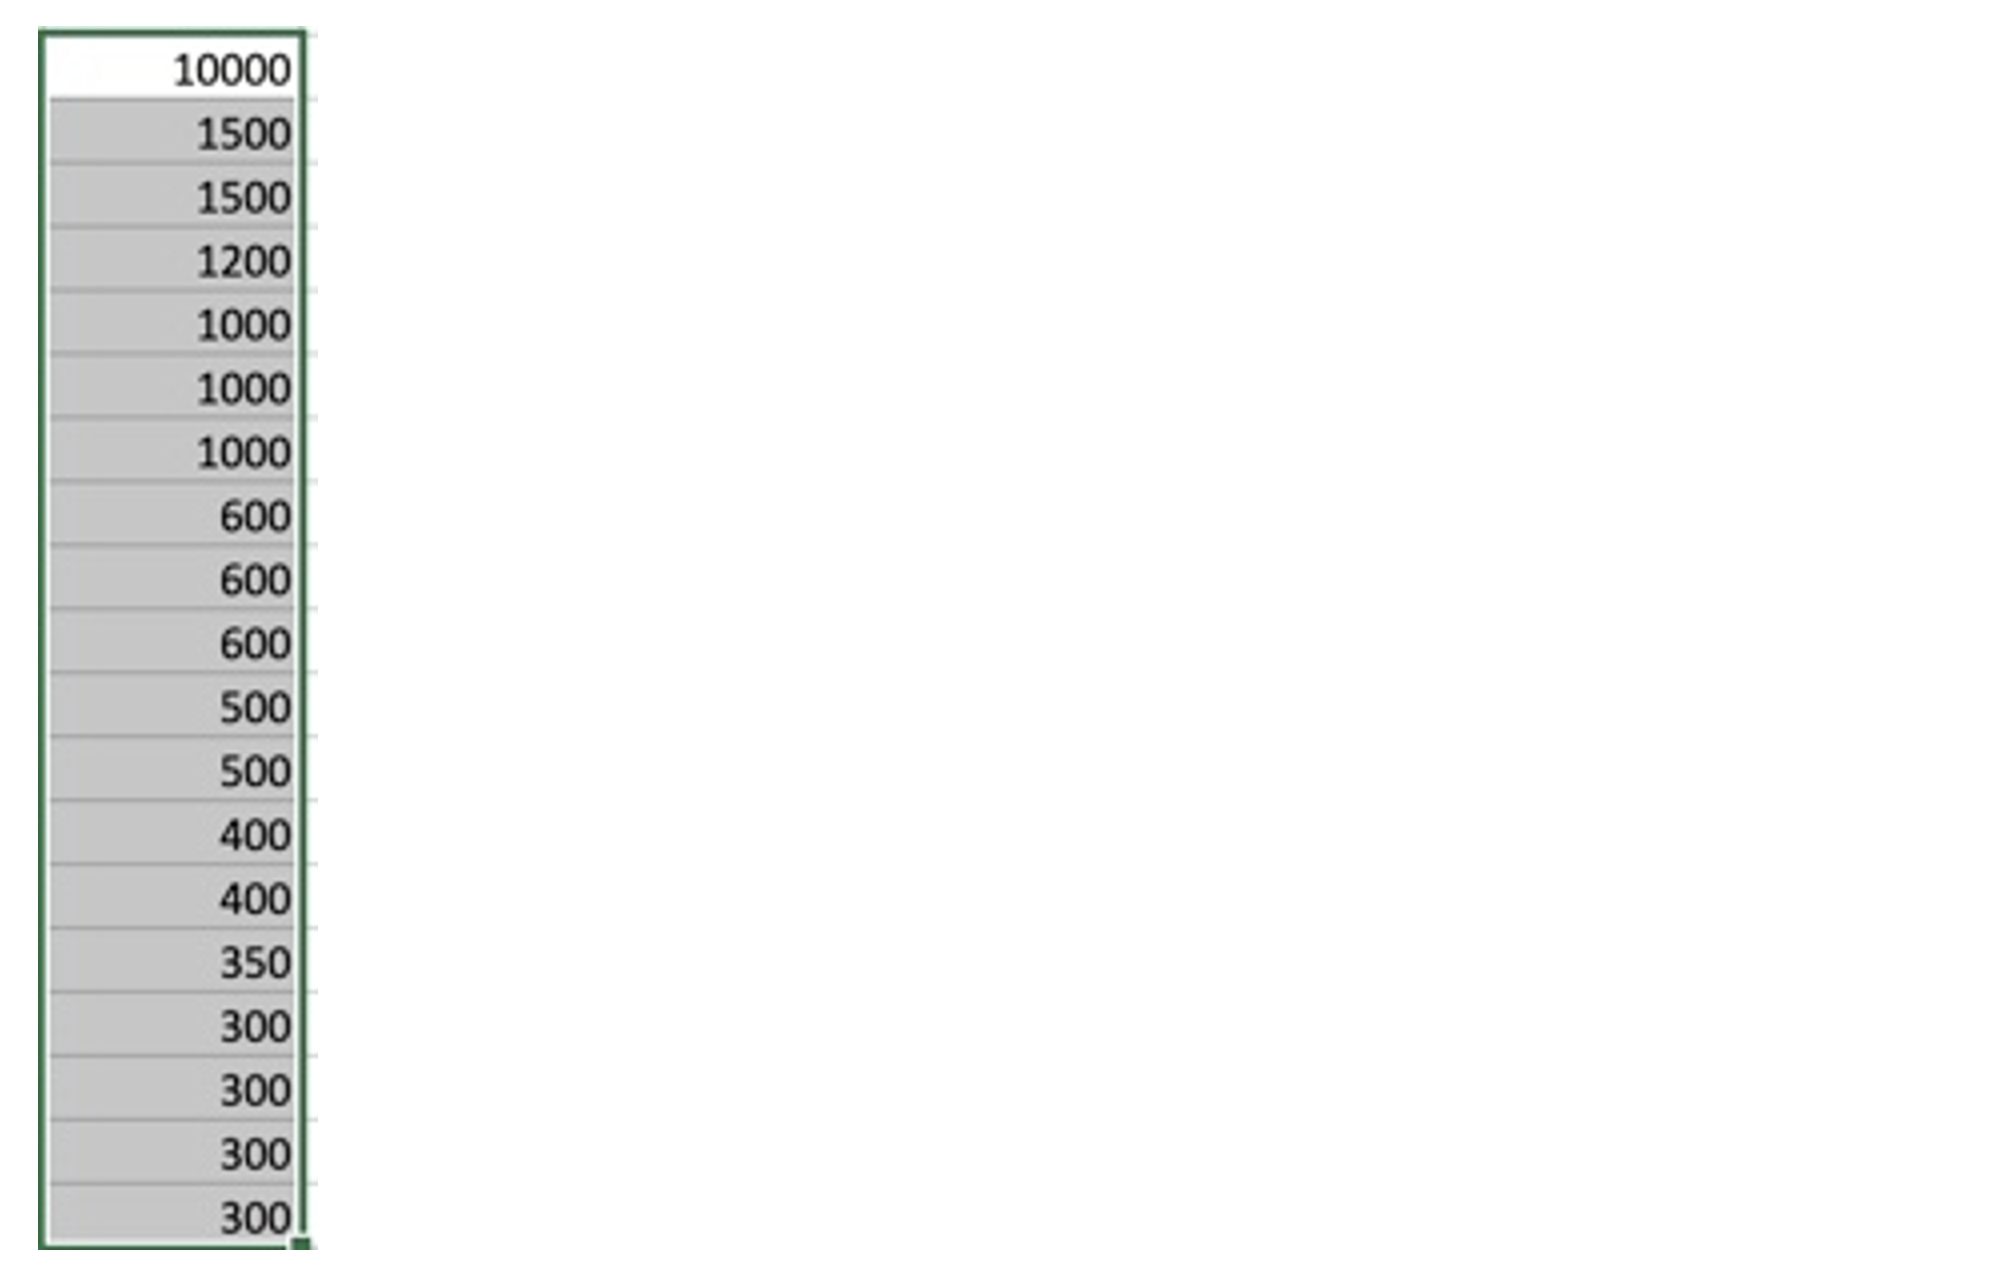
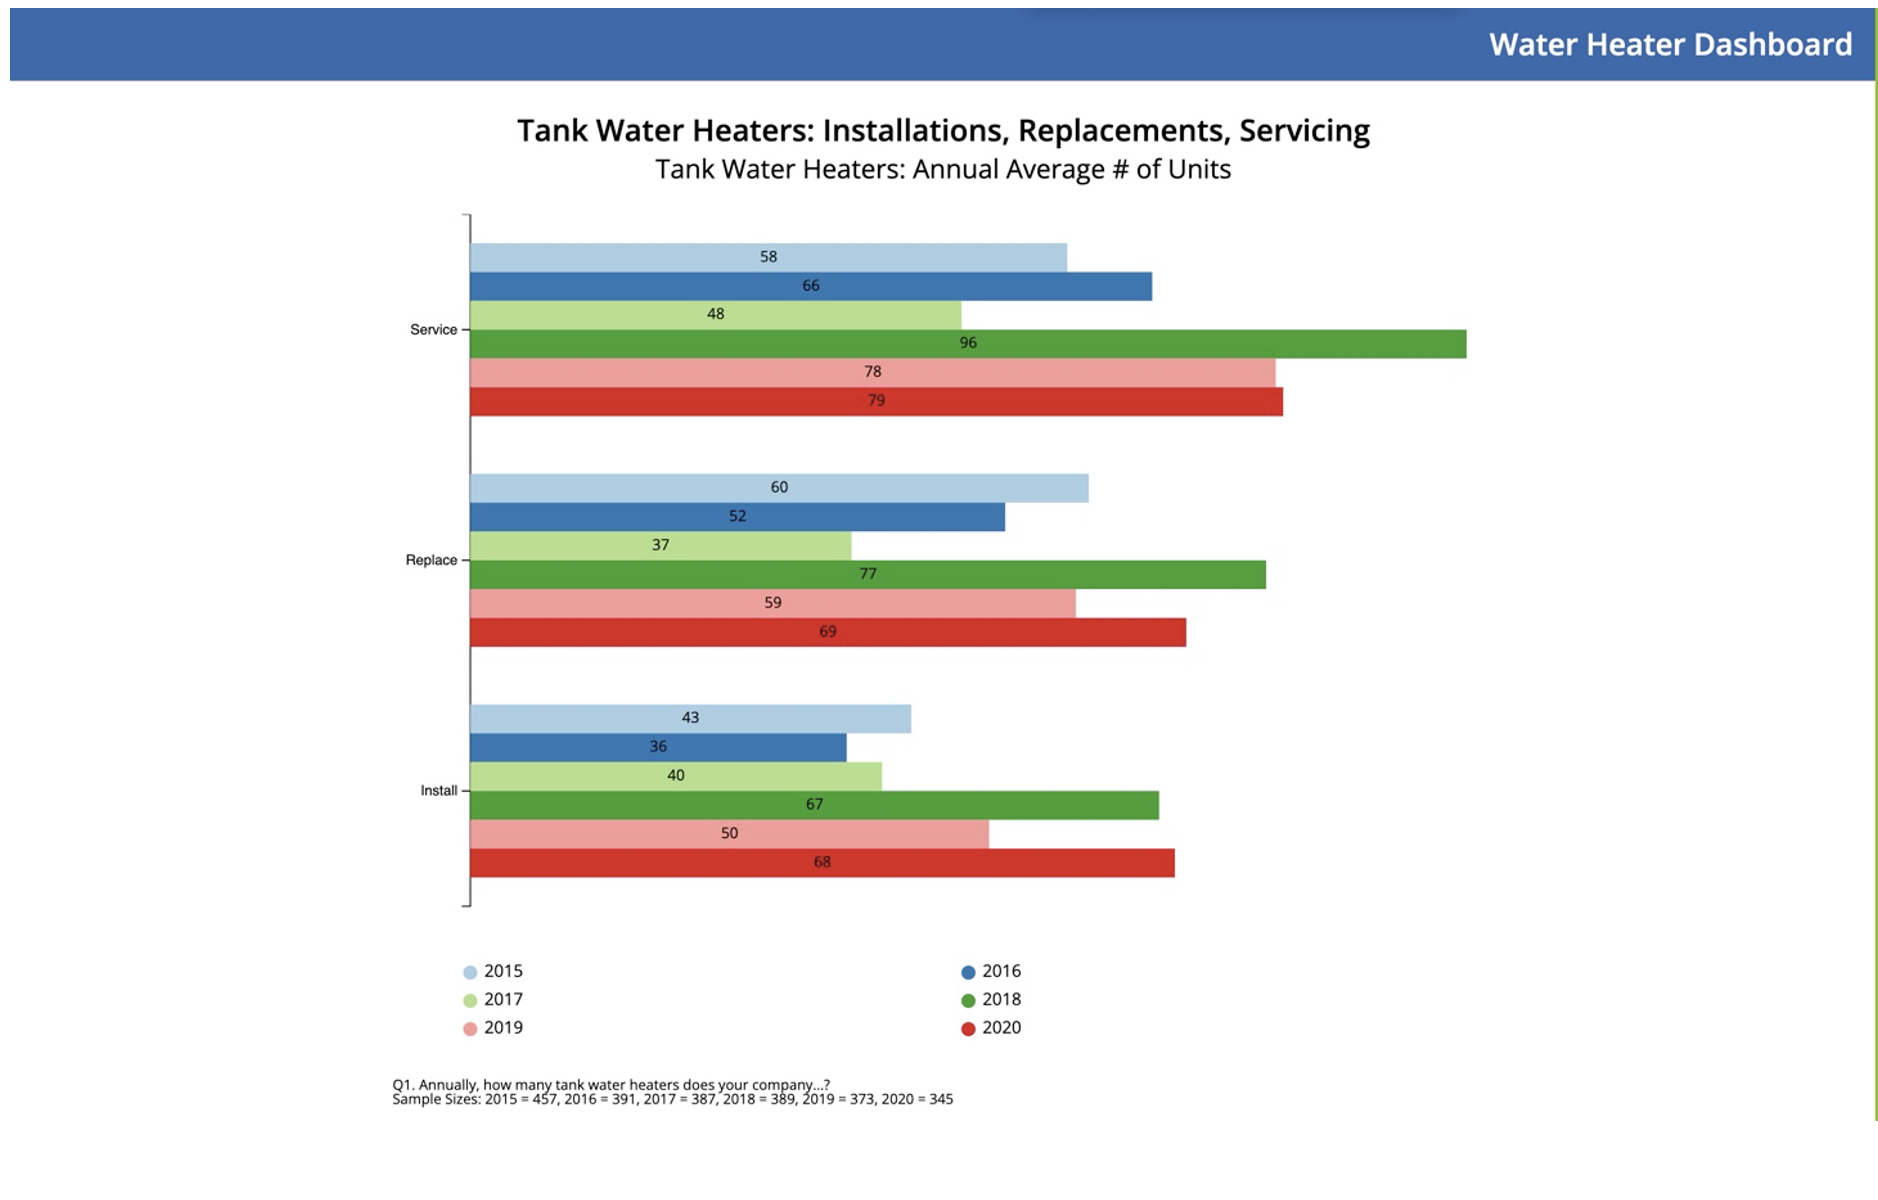
A good real-world example of this can be found in our Water Heater CLEAReport, where we can see a severe outlier well beyond four standard deviations from the mean. In this image, the 2018 "Annual average number of Water Heaters installed" data, one individual suggested they had over 10,000 water heater installations annually, over six times the following highest number of annual installations. Here's a screenshot of a portion of the data, sorted from highest to lowest, with the outlier in the white background:
And here, we have plotted the data before any elimination of extreme outliers (defined as data lying more than four standard deviations from the mean):
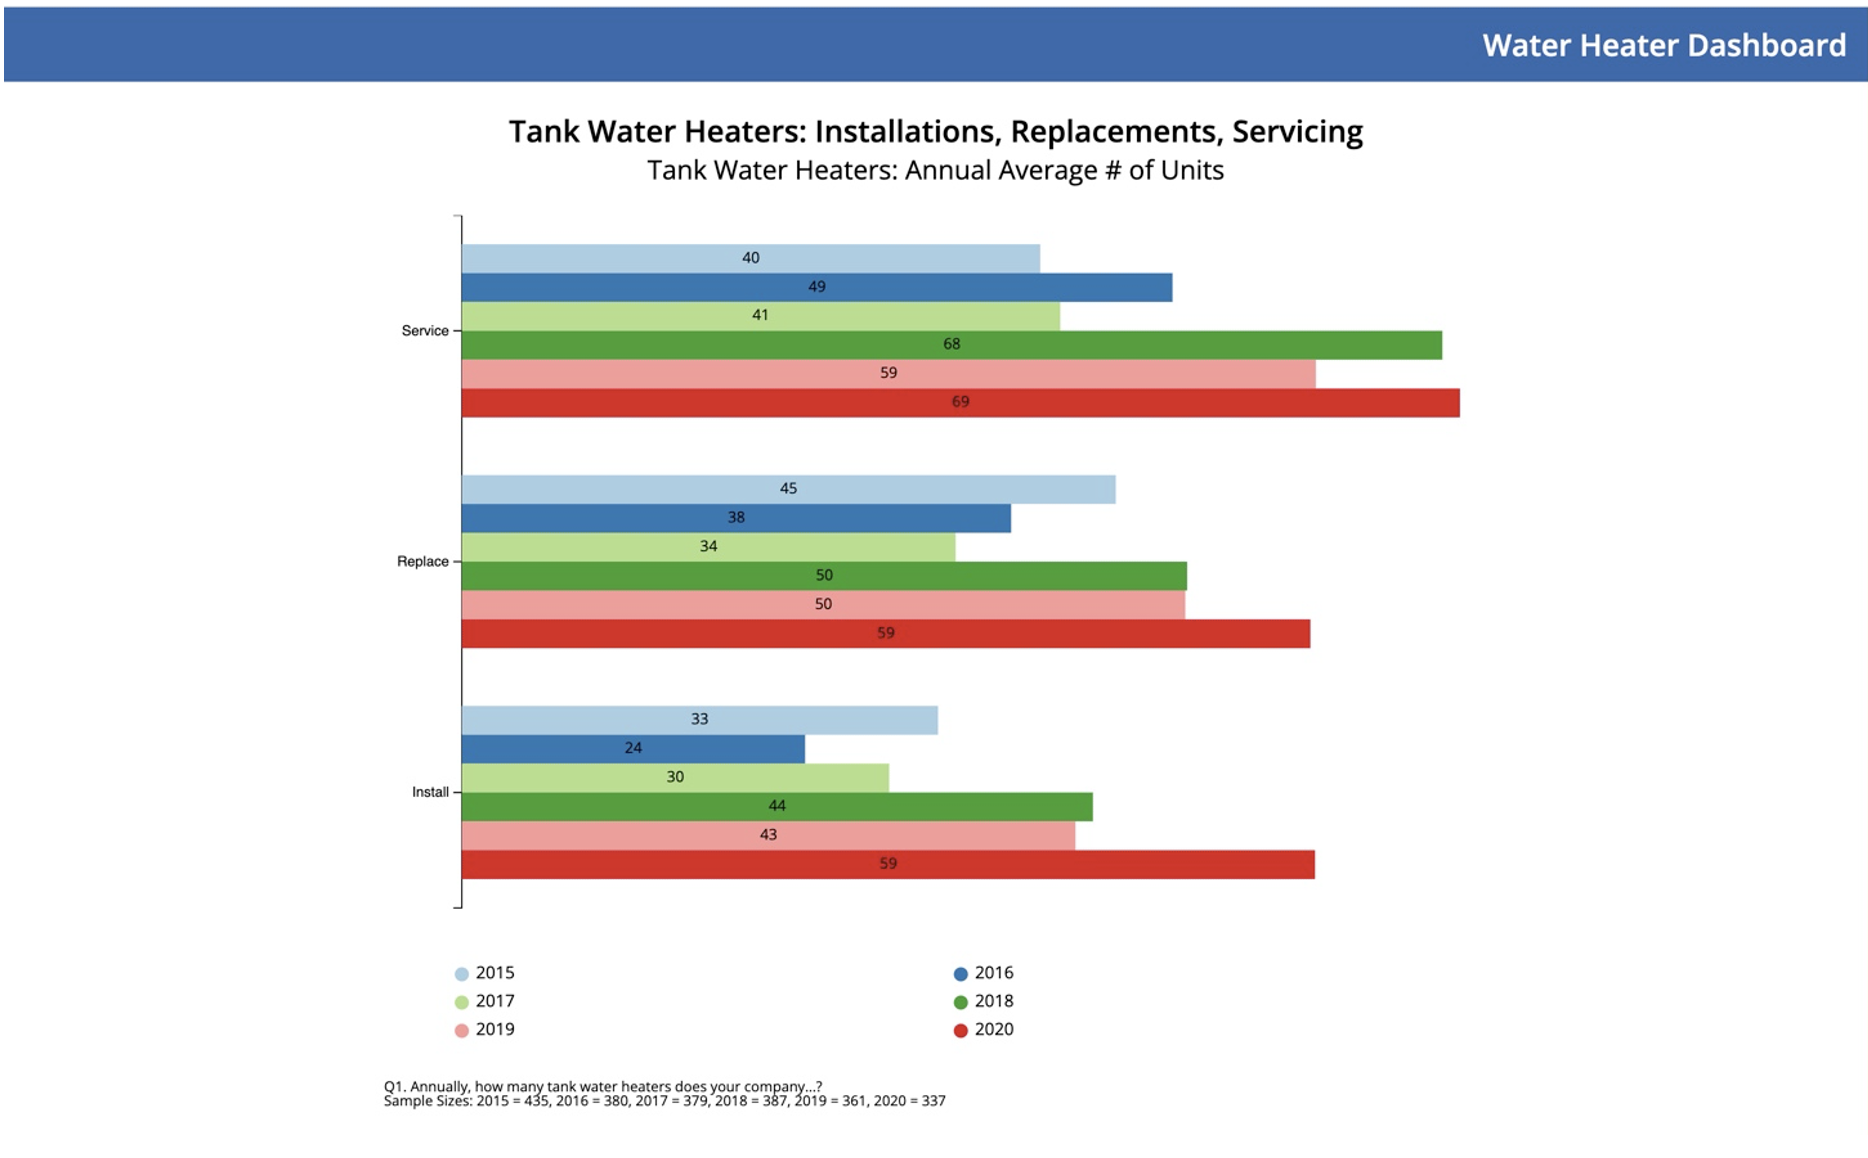
By removing these outliers, we can still accurately assess a more realistic annual average number for the industry, notwithstanding the underlying data distribution structure.
In this second image, we can see that just two individuals had pushed the average up significantly and likely represented exaggerated and inaccurate data. Although without forensic accounting of these individuals, we can feel relatively confident that this data is inaccurate and should not be included in the overall calculation of the averages.
If we consider the extreme unlikelihood of such an exceptionally high number, then when we calculate the expected value, we're going to multiply the number with the probability. Well, that probability is so small (whether it's due to inaccuracy or not) that it makes almost no contribution to the rest of the expected value calculation. So, we might as well omit it. We love Chebyshev's because it "enables us to derive bounds on probabilities when only the mean, or both the mean and the variance, of the probability distribution, are known."